


One of the most interesting features and where you can get a lot of information is the SEO Performance section.
These are the kinds of graphs and information you can find in the Google performance tab of your site:

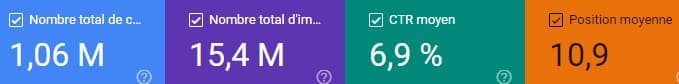
The KPIs
The section dedicated to the performance of your site in the Google SERPs is based on 4 key indicators: the number of clicks, the number of impressions, the average click-through rate (CTR) and the average position. Let’s have a look at the definitions of each of these 4 KPIs:
The number of clicks
The number of clicks is the number of times one of your pages was clicked on in the Google results pages.
Example: A user searches for “SEO agency” on Google and clicks on the Keyweo.com result.
The number of impressions
The number of impressions is the number of times your site has appeared in the Google results pages.
Example: a user searches for “SEO audit” and in the page viewed by the user, the result of the Keyweo.com site is displayed
The average CTR
The average click-through rate (also called average CTR) is the proportion of times one of your results was clicked on out of the number of times it appeared in Google. It is a variable that is calculated based on the 2 previous KPIs.
Example: out of 250 impressions, my page was clicked 10 times, so the CTR is 10/250*100 = 4%.
The average position
The average position corresponds, as the name suggests, to the position that your pages have held on average for all the impressions they have had, i.e. each time they have appeared in Google.
Example: my site has had 2 impressions, once in position 1, once in position 2, the average position will be (1+2) / 2 impressions = 1.5. Naturally, the closer this number is to 1, the better.
Filters
Whether it is the graph or the table, the data can be filtered in order to have information concerning more specific elements, for example, to follow the evolution of a single page, of all the articles of a blog, or on a specific keyword.
There are therefore 2 filter sections:
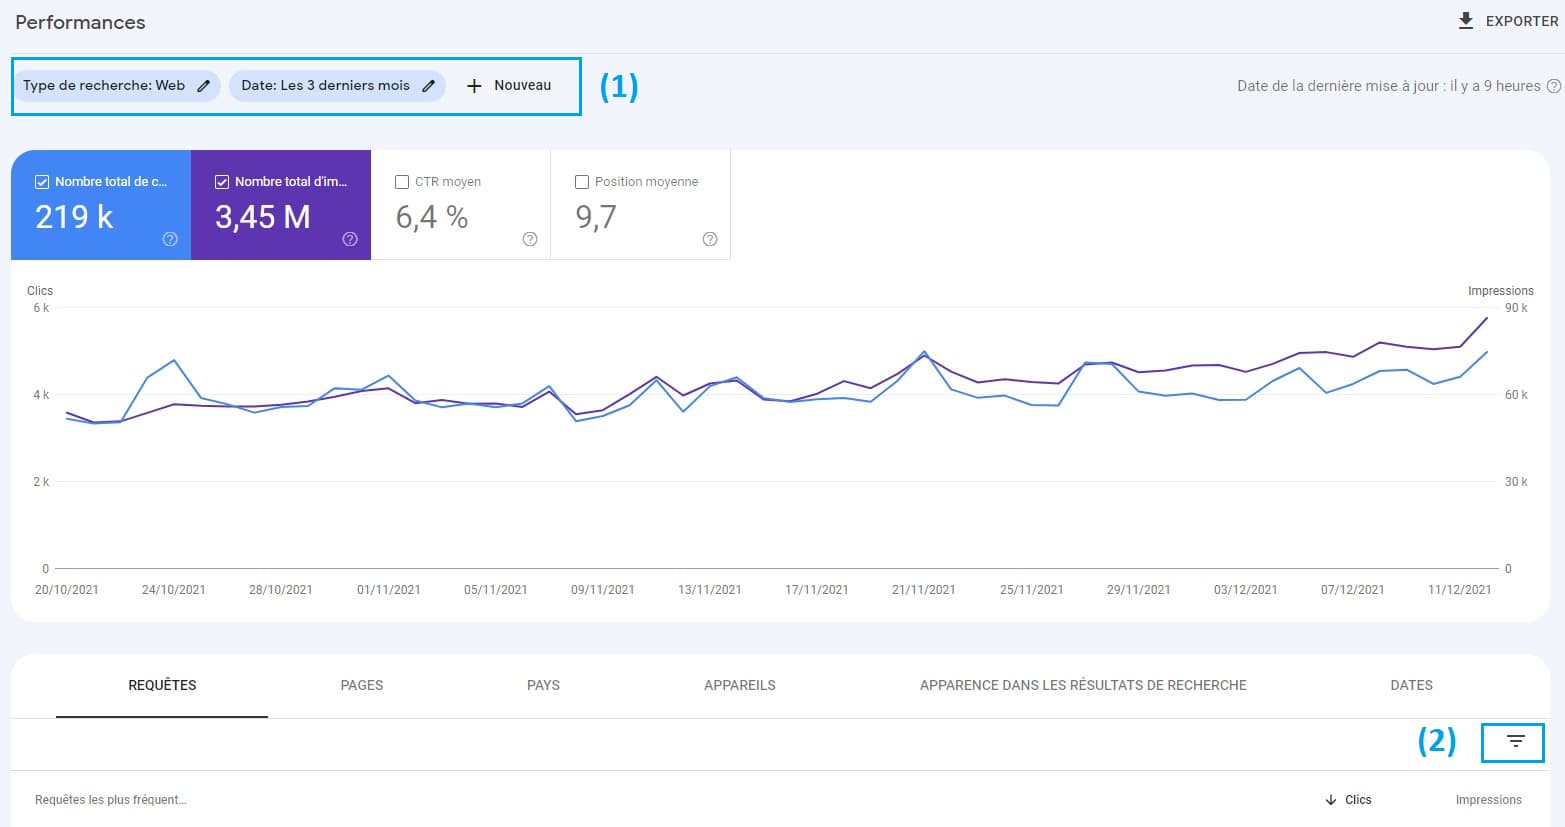
The first one allows you to filter the data of the graph and the table, while the second filter zone only affects the rows of the table at the bottom of the page.
Dates
The date filter offers preset values:
– the last 7 days
– the last 28 days
– the last 6 months
– the last 12 months
– the last 16 months
It is also possible to enter custom dates manually. However, it is not possible to have any data older than 16 months.
Queries
The tool also allows you to filter by query by specifying a word to include, a word to exclude, an exact word or a regular expression.
Pages
It is also possible to filter by URL in order to search for a specific page or a group of pages (folder, sub-domain, etc.).
Other filters
There are currently 4 other possible filters:
– Search type (web, image, video or news) – only present in the global filter
– Countries
– Devices (mobile, computer or tablet)
– Appearance in search results (good page experience, Web Light results, etc.)
All these filters can be used in combination to obtain the desired information.